If you want to uncover the different facets of a theory, it is better to use an image to display its various components.
If you want to uncover the different facets of a theory, it is better to use an image to display its various components.
Today its all about infographic which is a visual representation of your content which your learners will be benefited with.
What is an infographic?
An infographic is a collection of imagery, data visualizations like pie charts and bar graphs, and minimal text that gives an easy-to-understand overview of a topic.
Infographics can be incredibly effective educational tools, thanks to their ability to break complex information into easy-to-understand components and to make even dense data engaging. Discover why visual content is so effective in an educational context and learn how to design and use infographics for education.
Why Infographics Are So Effective in Educational
Contexts
No matter what type of information you want to teach, there’s a good chance that written or verbal instruction alone won’t get your message across. After all, not everyone can process language efficiently, and the average person is more apt to forget written or verbal communication than visual information. In fact, most people retain just 10 percent of what they hear and 20 percent of what they read, while they remember 80 percent of what they see.
Since approximately 65 percent of people are visual learners , adding image-based components to your teaching materials is a smart choice.
Infographics often prove so effective in educational contexts because they use imagery to highlight, explain, or enhance text-based information. They have the unique ability to capture attention, convey information, and encourage data retention despite their complex nature.
Two Ways Students Can Benefit From Infographics.
1. Introducing a Unit
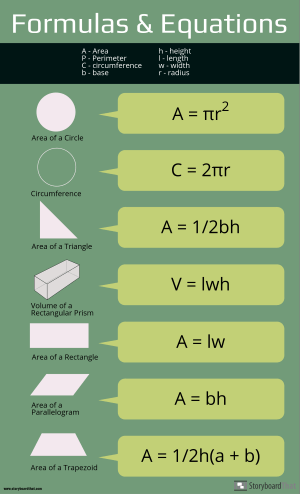
Sometimes before starting a new unit in math, a teacher might provide students with a card or sheet of paper that contains all the important formulas they will be learning and using during the next few weeks.
Using infographics ensures that students start off on as equal footing as you can provide.
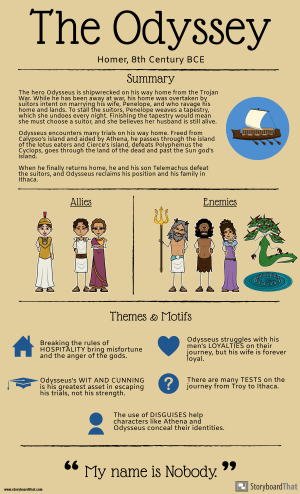
Example Infographics for Introducing a Unit:
- Timeline of events for your history unit
- Background information for a novel or short story
- Key terms and formulas for science
- Most common homophones
- Punctuation reference sheet
- Key figures for the unit
- Important mathematical formulas
- Verb conjugation endings
- Sentence structures
Once you've created your amazing infographics, you can include it in the beginning of your PowerPoint presentation, send it out to your students through Storyboard That (or your classroom management system), or print it and pass it out to students at the start of the class.
2. Summarizing a Unit

Infographics can be created after a unit as well, to provide students with a summary of key information. Many of the examples listed above can also fit into this category as well. This will also help students prepare for final exams, since they'll have something to use as a starting point for studying. These takeaways won't include every detail, so students should still pay attention and take notes during the class.
Incorporate Infographics Into Learning Activities
Introducing your class to examples of great infographics is a smart way to use visual content in your lesson plans. Not only can this type of visual content increase student interest and engagement, but infographics can also help students learn about important topics ranging from history and literature to math and science. Depending on the focus of your classroom and the level of your students, you could use infographics in a number of learning activities.
- Try introducing a new module by using an eye-catching infographic to convey the basics or generate interest.
- Encourage students to read statistics, interpret data, and draw conclusions from an infographic.
- Rather than having students read a textbook passage or a news article, use an infographic to start a discussion or lead a classroom debate.


Nice presentation with important information, thanku for sharing 😊
ReplyDeleteThank you
DeleteAll the points are logically explained. Very useful information.
ReplyDeleteVidhya
Thank you
DeleteThe explanation is well arranged and presented. Very useful information
ReplyDeleteVidhya
Thank you
DeleteVery informative and good presentations
ReplyDeleteVery informative and helpful
ReplyDeleteThank you
Delete